1、随机抽取8个点,进行绘图。
n = 8;
x = rand(n,1);
y = rand(n,1);
plot(x,y,'.')
axis([0 1 0 1])
2、按“Enter”键。
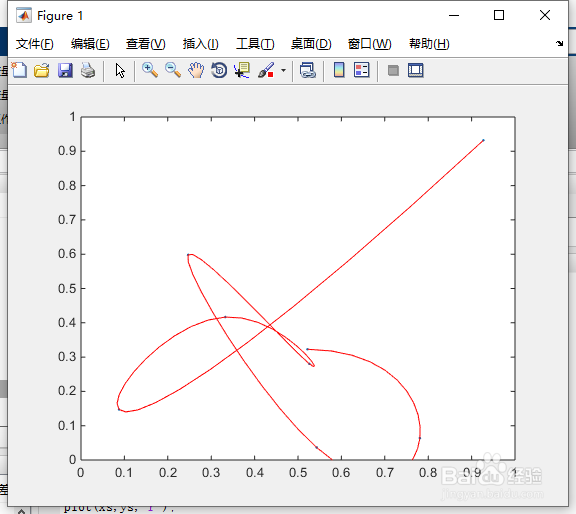
如图1所示。

3、用两条泪盲爹样条曲线插值点,用较细的间距计算炼著。用红线标出插值曲线。
t = 1:n;
ts = 1:1/10:n;
xs = spline(t,x,ts);
ys = spline(t,y,ts);
hold on
plot(xs,ys,'r'瞧胆);
hold off
4、按“Enter”键。
如图2所示。