【Mathematica】用ComplexPlot绘制辐角图

 时间:2024-10-17 11:27:06

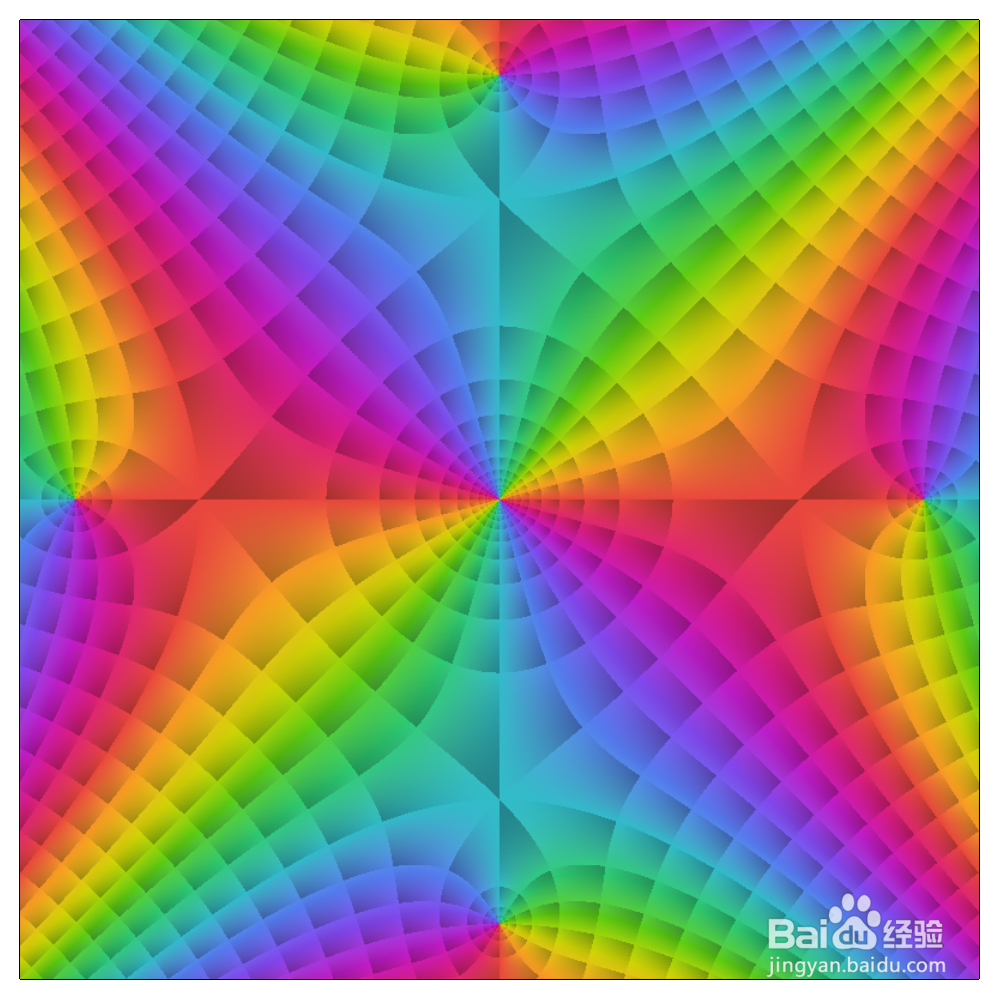
1、Image[ComplexPlot[Sin[3z], {z, -2 - 2 I, 2 + 2 I},ColorFunction -> "CyclicLogAbsArg",PlotPoints->300,Frame->False,ImageSize->1000]]绘制函数Sin[3z]的辐角图,并使用色调来凸显函数的特征。

【Mathematica】用ComplexPlot绘制辐角图

2、Sin[3z]比Sin[z],只是画图范围变大了而已:

【Mathematica】用ComplexPlot绘制辐角图

3、Sin[z^2]:

【Mathematica】用ComplexPlot绘制辐角图

4、Sin[z^6]:

【Mathematica】用ComplexPlot绘制辐角图

5、(Sin[z]+1)/(Sin[z]-1):

【Mathematica】用ComplexPlot绘制辐角图

6、Sin[z^3]+1)/(Sin[z]-1):

【Mathematica】用ComplexPlot绘制辐角图

7、Sin[1+z+z^2]:

【Mathematica】用ComplexPlot绘制辐角图

8、Log[2z]:

【Mathematica】用ComplexPlot绘制辐角图

9、(3z)^(3z):

【Mathematica】用ComplexPlot绘制辐角图
  • 移动套餐在哪里退订
  • 移动套餐怎么退订
  • 王者反制位乱选英雄怎么举报?
  • 怎么退订未生效的套餐
  • 中国移动客户端如何更换套餐
  • 热门搜索
    怎么计算排卵期 伤口化脓怎么办 先科音响怎么样 纤怎么组词 衣服起球怎么办 怎么看朋友圈访客记录 牛肚怎么做好吃 小麦胚芽怎么吃 皇太极怎么死的 照片分辨率怎么看